It Started with a Two-Column Spreadsheet
The project was a 5 MW commercial rooftop. Standard stuff—flat roof, good southern exposure, a client who wanted “the best value.” As the procurement manager, my job was simple on paper: find the cheapest modules that met the spec.
Late 2023. I had quotes from six manufacturers. Three were Tier 1 Chinese producers, two were Korean, and one—Maxeon—came in at a 30% premium. My first reaction? Easy delete.
But the project lead, a guy named Tom who’d been doing this for 25 years, stopped me. “Don’t bin it yet,” he said. “Look at the degradation curve. Look at the temperature coefficient. That’s where the cost is.”
I wasn’t convinced. 30% more upfront? For the same wattage? Seemed like a luxury. But I built a new spreadsheet. A 25-year cash flow model, not a 1-year comparison.
That spreadsheet changed my mind.
The Surface Illusion of ‘Cost’
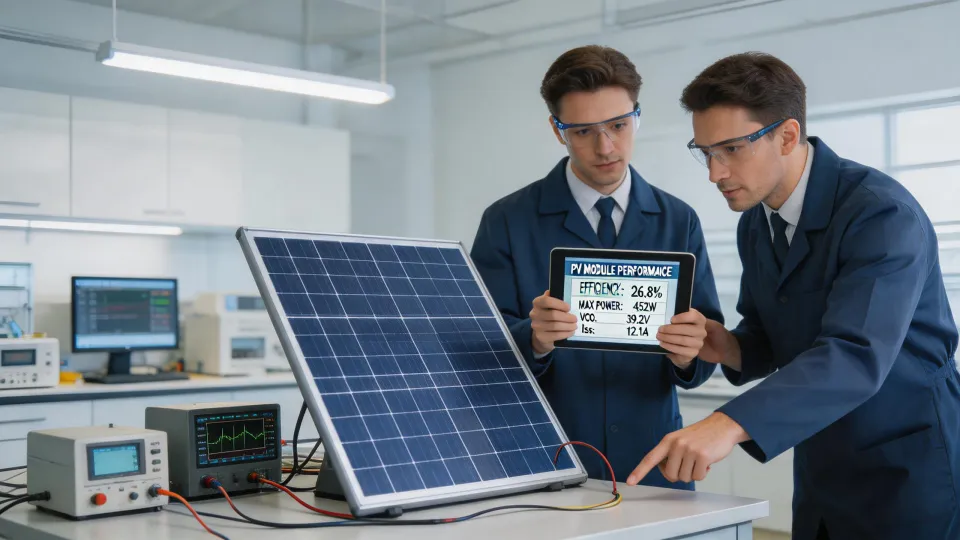
From the outside, it looks like a solar panel is a solar panel. Same wattage? Same expected output? Pick the cheaper one. The reality is far more nuanced.
People assume the lowest module price means the lowest system cost. What they don’t see is the combination of three factors that silently eat into a project’s return over two decades.
Factor 1: Degradation Rate
Standard PERC panels degrade at about 0.5% to 0.7% per year. Over 25 years, that means the system at year 25 is producing only 82-87% of its original output. Maxeon’s IBC technology, with its 40-year linear warranty, guarantees 92% retained output at year 25. That’s a 5-10 percentage point difference in the final decade of operation.
For a 5 MW system, that difference in the later years is worth hundreds of thousands of dollars in lost generation. I’m not guessing—I modeled it. The premium disappeared by year 8 in our model. Everything after that was pure gain.
Factor 2: Temperature Coefficient
This one’s less obvious. Maxeon’s cells have a temperature coefficient of -0.29%/°C. Most conventional panels are around -0.35%/°C or worse. Doesn’t sound like much? On a hot roof in Arizona or Texas, panel temperatures hit 65°C or more. That’s a 40°C delta above the 25°C standard test condition.
0.06% per degree × 40 degrees = 2.4% more output on every hot day. For a system that spends 100+ days a year above 35°C ambient, this adds up fast. It’s free energy you didn’t pay for.
Factor 3: Shading and Mismatch Tolerance
This was the one that bit us on an earlier project. I assumed that string inverters and standard modules would handle partial shading adequately. Didn’t verify. Turned out the building had a parapet wall that cast a shadow line across 15% of the array for 2 hours in the morning.
With standard modules and a string inverter, that shadow dragged down the entire string’s output. We ended up adding optimizers—a $40k unplanned cost. With Maxeon’s IBC cells and integrated shingle structure, their modules handle partial shading far more gracefully at the cell level. Might’ve avoided that optimizer cost entirely.
The Turning Point: The 10,000-Watt Inverter Dilemma
As our analysis deepened, we hit the hardware decision. The client had budgeted for a 10,000-watt inverter, assuming that’s what they needed for their load calculations. Sizing a power inverter for a solar generator system isn’t just about peak wattage. It’s about surge capacity, continuous load, and how the inverter handles the DC input from high-efficiency panels.
High-efficiency modules like the Maxeon Gen III generate higher voltage and current at the same rated wattage. An inverter that’s fine for a standard 400W panel might clip or degrade performance when paired with a 440W+ IBC module.
The question isn’t just “can it handle 10,000 watts?” The real question is: can it handle the specific electrical characteristics of these panels without throttling down?
Why does this matter? Because pairing a cutting-edge panel with an off-the-shelf inverter can create a hidden bottleneck. You pay for the premium panel but don’t get the full generation benefit.
The System Location Lesson
There’s a question that always comes up: “Where is the solar system located?” For the client, it was easy—on the roof. But for the procurement side, the question means more. Where are the components sourced? Where is the manufacturing? Where is the warranty serviced?
I learned never to assume that a warranty is global. We had a partial failure on a microinverter once—a $600 part. The manufacturer required return to a US address. The shipping, the downtime, the labor. That “free” replacement cost us $1,200 in total. Period.
Maxeon’s manufacturing footprint includes facilities in the US and Malaysia, with warranty support handled by their global service network. That matters when you’re building a system you need to run for 30+ years.
What I’d Do Differently
I still kick myself for not doing this deep-dive TCO analysis earlier. In Q2 2023, we approved a 3 MW project with lowest-bid modules. They’re fine panels. They work. But by year 15, the generation gap from degradation will be visible. By year 25, it’ll be significant.
If I’d built the model upfront, we might have spent more initially but captured higher returns over the system life. The “savings” today become a cost tomorrow.
Here’s my takeaway checklist for anyone specifying a commercial solar system now:
- Model 25 years, not 1. Use degradation curves from the manufacturer’s warranty data. Don’t just compare module wattage.
- Check the temperature coefficient. If your project is in a hot climate, this is a free upgrade. Maxeon’s -0.29%/°C is best-in-class.
- Match the inverter to the module. A 10,000-watt inverter isn’t a single spec point. Confirm compatibility with the specific panel voltage and current.
- Ask about manufacturing location. Not for geopolitics—for warranty logistics. Where will the replacement come from, and who pays for shipping?
- Build in contingency for shading. Even if the survey says “no shade,” assume you missed something. One morning shadow line can cost thousands in optimizers or lost output.
There’s something satisfying about optimizing a system that will outlast my career. After the stress of budget comparisons and spreadsheet fights, finally seeing a design that balances upfront cost with 30-year reliability—that’s the payoff.
Oh, and one more thing. That 30% premium I mentioned? On our modeled 5 MW system, it translated to about a 15% higher initial module cost. But the net present value of the additional generation over 25 years was 2.3x that premium. Solar is a long game. It pays to think that way.
(Prices referenced are based on Q3 2023 quotes for a 5 MW commercial installation in the US Southwest. Verify current rates.)
Ask a related Maxeon question